Written by Katherine Eaton
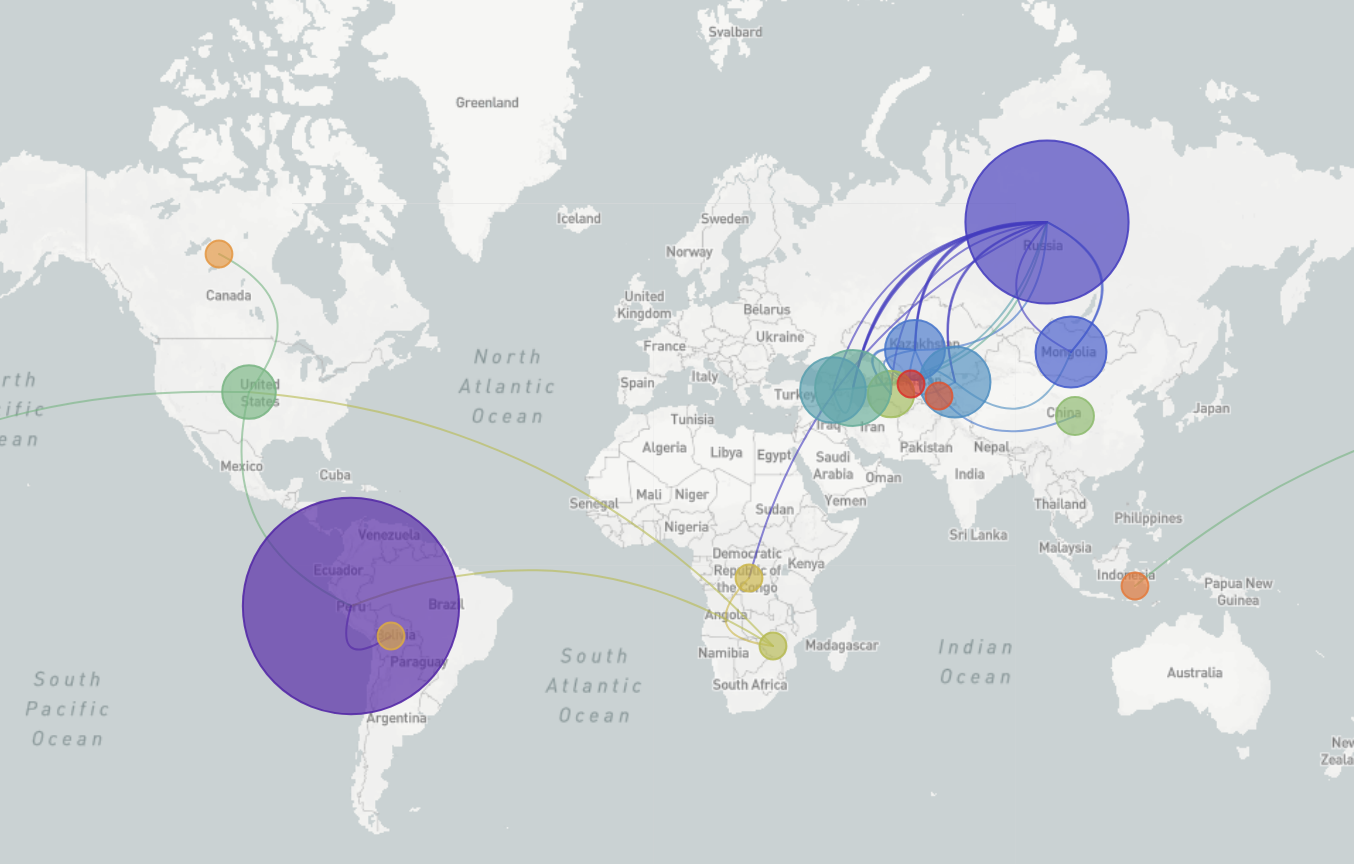
For the final visualization of my residency, I constructed a NextStrain Narrative Exhibit. This digital display weaves together geospatial information, genetic data, and interpretative text to explore the history of the infectious disease “The Plague”.
As a key part of my doctoral work, this exhibit serves 3 purposes:
- A tool for exploratory data analysis, helping me discover spatial and temporal trends.
- A platform to contextualize and discuss, encouraging me to find new sources and multimedia links to support my interpretations.
- An avenue to publish, removing several barriers to sharing ideas and getting feedback
Learning new digital tools can be an immensely challenging task, so I also used this visualization as practice for my other exhibit at the 2020 Digital Humanities Summer Institute Conference and Colloquium. I will be presenting (virtually) a digital demonstration of how these exhibits advance my research, diving deeper into the 3 points above.
As this is preliminary work, I’ve placed an emphasis on overcoming technological hurdles. Moving forwards, I’m looking forward to incorporating more interpretive theory. I chose this exhibit platform in particular because it aligns well with the anthropological principles of nuance and local context.
On one hand, this exhibit can facilitate large-scale narratives that sweep across the globe and span thousands of years. But alternatively, it’s also possible to zoom in on finer details. For example, I can examine plague outbreaks in 1950s Armenia, which should be contextualized within the Soviet Union’s antiplague (AP) system, considered to be one of the “most extensive plague-eradication efforts in recorded history”.
Overall, I’ve found working with digital exhibits, such as those shown here, offers complementary approaches to both a “distant” and “close” reading of my data. It has been a uniquely rewarding experience, and I’m looking forward to experimenting more!

Leave a Reply